

School Profile
Counselors
|
Brenda Poznanski |
Dylan Mullin |
Lisa Futrell |
Jill Leonard |
Andrea Tencza |
Leigh Alcorn |
|
Senior Director of School Counseling & Admission |
Associate Director of School Counseling |
School Counselor |
School Counselor |
School Counselor |
Administrative Assistant for School Counseling |


About BG
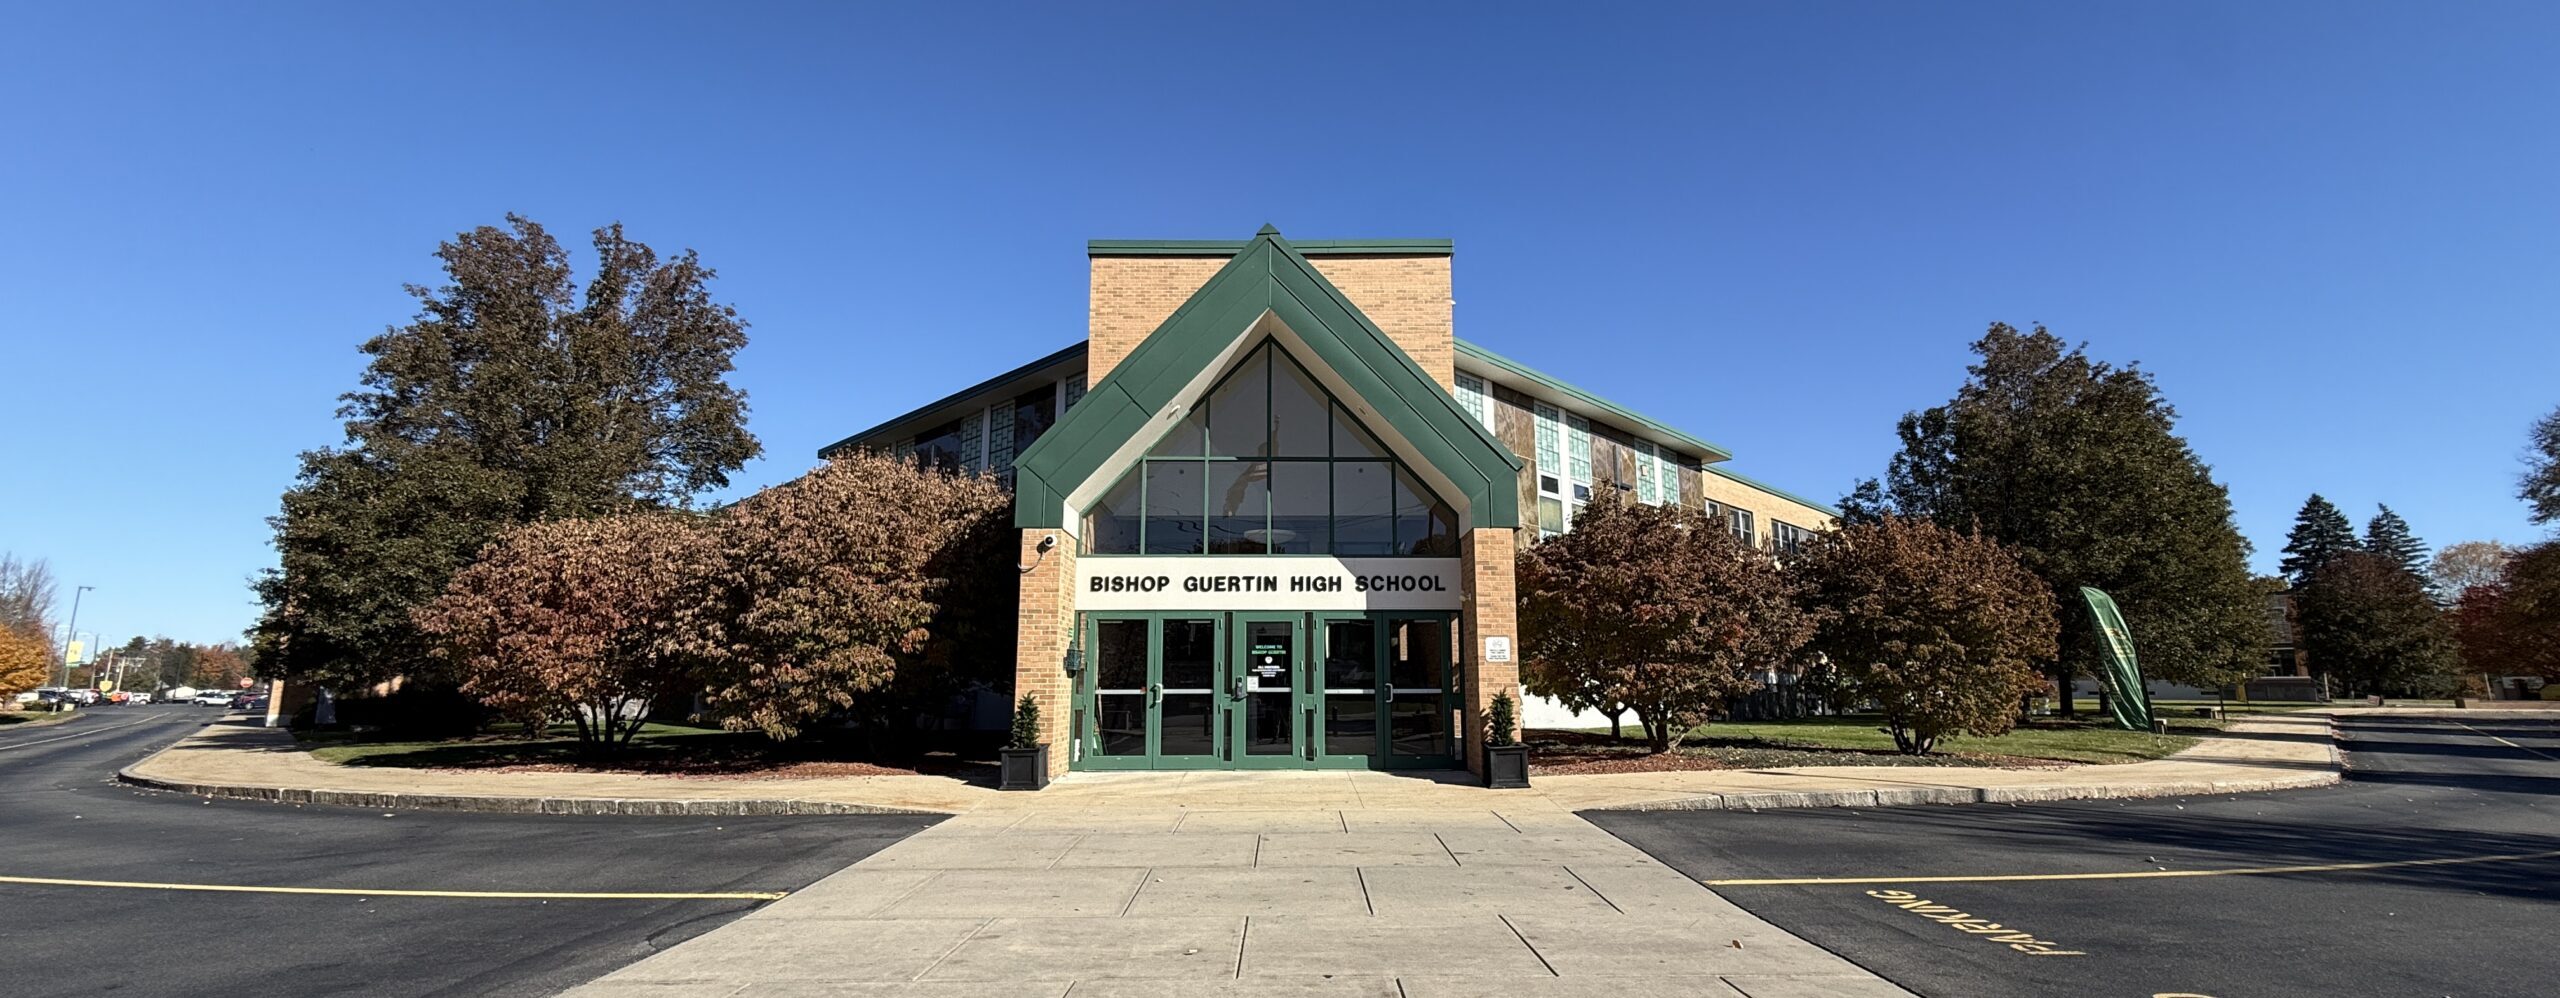
Bishop Guertin High School, an independent Catholic high school sponsored by the Brothers of the Sacred Heart, serves approximately 770 students in grades 9-12. Located in Nashua, NH, the school draws students from a 40-mile radius, including the Greater Nashua area as well as Salem, Lowell, Billerica, and Manchester.
Admission is selective, based on an entrance exam, academic performance, essays, and teacher recommendations. Open to students of all faiths and backgrounds, Bishop Guertin is dedicated to accessibility, providing over $1.5 million annually in financial assistance.
The school’s rigorous college-preparatory curriculum and comprehensive whole-person development program foster academic excellence, leadership, and personal accountability.
Graduate Statistics
-
175-200 students per graduating class (184 in Class of 2026)
-
98% high school graduation rate
-
97% of 2026 graduates attend 4-year colleges, with the remainder splitting between 2-year colleges, postgraduate athletics, the military, and workforce.
-
96% of graduates persist from freshman to sophomore year of college*
-
81% of graduates complete degree within four years*
Where Our Students Go...
Most Frequently Attended
by students attending 2017-2026
-
Assumption University
-
Bentley University
-
Bryant University
-
Endicott College
-
Fairfield University
-
Fordham University
-
High Point University
-
Merrimack College
-
Northeastern University
-
Providence College
-
Quinnipiac University
-
Rensselaer Polytechnic University
-
Rochester Institute of Technology
-
Sacred Heart University
-
So. New Hampshire University
-
St. Anselm College
-
Stonehill College
-
Suffolk University
-
University of Alabama
-
University of Connecticut
-
University of Massachusetts – Amherst
-
University of Massachusetts – Lowell
-
University of New England
-
University of New Hampshire – Durham
-
University of Vermont
-
Wentworth Institute of Technology
-
Worcester Polytechnic Institute
Selective Institutions Attended
2021- present
-
Boston College
-
Boston University
-
Colby College
-
Colgate University
-
College of the Holy Cross
-
Cornell University
-
George Washington University
-
Georgetown University
-
Georgia Technical University
-
Hamilton College
-
McGill University
-
New York University
-
Princeton University
-
Stanford University
-
The Ohio State University
-
Trinity College
-
Tufts University
-
United States Air Force Academy
-
University of Michigan
-
United States Military Academy
-
United States Naval Academy
-
University of Notre Dame
-
University of Southern California
-
University of Virginia
-
Vanderbilt University
- Villanova University
- Yale University
Graduation Requirements
A minimum of 24 credits is required. The majority of students graduate with 28 credits.
|
English |
4.0 |
|
Religious Studies |
4.0 |
|
Mathematics |
3.0* |
|
Science |
3.0* |
|
Social Studies |
3.5 |
|
World Language |
2.0 |
|
Health and Fitness |
1.0 |
|
Fine Arts |
0.5 |
|
Computer Science |
0.5 |
* The majority of Bishop Guertin Students take four years of math and science.
Accreditation
Bishop Guertin is accredited by the New England Association of Secondary Schools and Colleges (NEASC) and the New Hampshire Department of Education
Grading Distribution and Standardized Test Performance
- Students receive 2/3 of a GPA weighting point for AP-level; 1/3 of a point for H-level course.
- Core courses include: English(4 years), Mathematics (3*), Social Studies (3.5), World Language (2*), Science (3*), and Theology (4).
- Minimum passing grade (D) is 65%. (*)
* – BG recommends 4 years, but does not require.
Advanced Placement | Five-Year Performance
- Enrollment in Honors or Advanced Placement (AP) courses is by invitation only based on prior academic performance.
- Students are typically limited to three AP courses in a year.
- All students with an “AP” course on transcript are required to take the AP Examinations.
- In total, 35%-40% of seniors will score a 3 or higher on at least one AP Exam during high school.
- Since 2020, 277 students have received AP Scholar recognition (29% of graduates).
Highest Course Levels
|
Computer Science |
AP Computer Science A and AP Computer Science Principles, Programming Honors |
|
English |
AP English Language and Composition and English Literature and Composition |
|
Fine Arts |
AP Studio Art, Honors Band and Chorus, AP Music Theory |
|
Health/Fitness |
College Preparatory course only |
|
Math |
AP Calculus AB and BC, AP Statistics |
|
Science |
AP Physics (requires Physics Honors as a prerequisite). |
|
Seminar |
AP Research and Seminar |
|
Social Studies |
AP US History, US Government and Politics, and AP Comparative Politics (World History Honors students have the option to take the AP exam) |
|
Theology |
Bioethics Honors, and Tolkien Honors |
|
World Language |
AP French, AP Spanish, and AP Latin, Greek Honors |
| Grading Scale | GPA Distributions | Average SAT (Classes of 2026) | Course Grade Distributions | ||||||
|---|---|---|---|---|---|---|---|---|---|
| Letter Grade |
Weighted GPA |
Class of 2026 Students in GPA Range |
Class of 2027 Students in GPA Range |
% Taken | Ev. Based Reading/ Writing |
Math | % of Grades in Core* CP Courses |
% of Grades in Core* H Courses |
% of Grades in AP Courses |
| A+ | 4.33 | 1% | 1% | 100% | 720 | 765 | 3% | 2% | 2% |
| A | 4.00 | 10% | 7% | 100% | 686 | 647 | 13% | 16% | 18% |
| A- | 3.66 | 21% | 21% | 95% | 630 | 615 | 16% | 21% | 25% |
| B+ | 3.33 | 23% | 26% | 84% | 608 | 588 | 14% | 17% | 18% |
| B | 3.00 | 19% | 15% | 68% | 569 | 540 | 18% | 22% | 21% |
| B- | 2.66 | 18% | 15% | 52% | 549 | 501 | 12% | 10% | 11% |
| C+ | 2.33 | 6% | 8% | 63% | 518 | 494 | 10% | 5% | 4% |
| C | 2.00 | 2% | 5% | 8% | 3% | 1% | |||
| C- | 1.66 | 2% | 3% | 2% | 1% | ||||
| D+ | 1.33 | 2% | 1% | ||||||
| D * | 1.00 | 1% | |||||||
| F | 0.00 | 1% | |||||||
| Average | 3.38 | 3.30 | 604 | 578 | – | – | – | ||
Class of 2026 Acceptances